Become a site
Schools, healthcare facilities, businesses, municipalities, research organizations and more can join the Lungfish network by participating in our air or wastewater sampling programs.
Get in touch →
Air sampling
What happens between a cartridge going into a sampler and a named pathogen coming out the other end.
Every air sample follows the same route, from a cartridge going into a sampler at a school or healthcare facility through to the variants we can name at the end of it. Two points along the way are optional: point-of-care testing gives a same-day answer where an instrument is deployed, and a PCR or dPCR assay quantifies the extract without waiting for sequencing. Everything else runs in sequence.
Stage 1
The sampling cycle runs at a single monitoring location. A trained site operator installs a fresh collection cartridge into the air sampler, the device runs for a scheduled period drawing ambient air through it, and the operator returns to remove and seal the cartridge for shipment to the laboratory.
The cartridge holds a collection substrate — a filter, a coated surface, or a charged plate — that traps airborne particles as air passes through it. Which one depends on the sampler deployed at that site:
The operator logs the sampling event in the Lungfish mobile app at both the start and the end of collection: the cartridge barcode, the device, the operator and the start time going in; the end time, the total collection duration and the physical condition of the cartridge coming out. Those records share one sampling event identifier that follows the sample through every stage that follows.

A fresh, sealed cartridge is loaded into the sampler and the device is activated. The operator opens the Lungfish mobile app, scans the sampler's barcode and then the cartridge barcode, and starts the run — which creates the sampling event record and begins the collection timer.
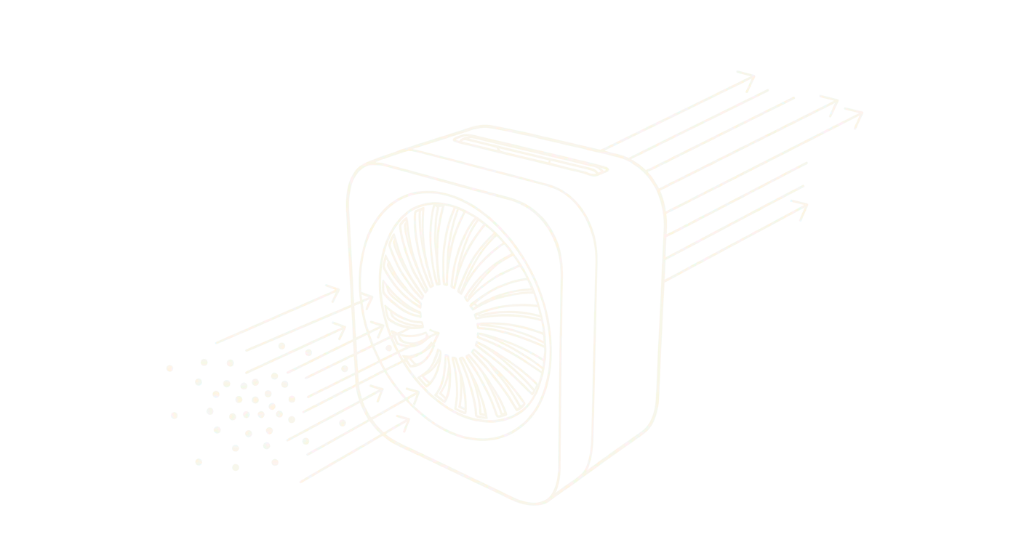
The sampler draws air through the device, capturing airborne particles onto the collection substrate inside. How long it runs depends on the space being monitored, but most sites sample over a two or three day period. The run ends when the operator stops the device.
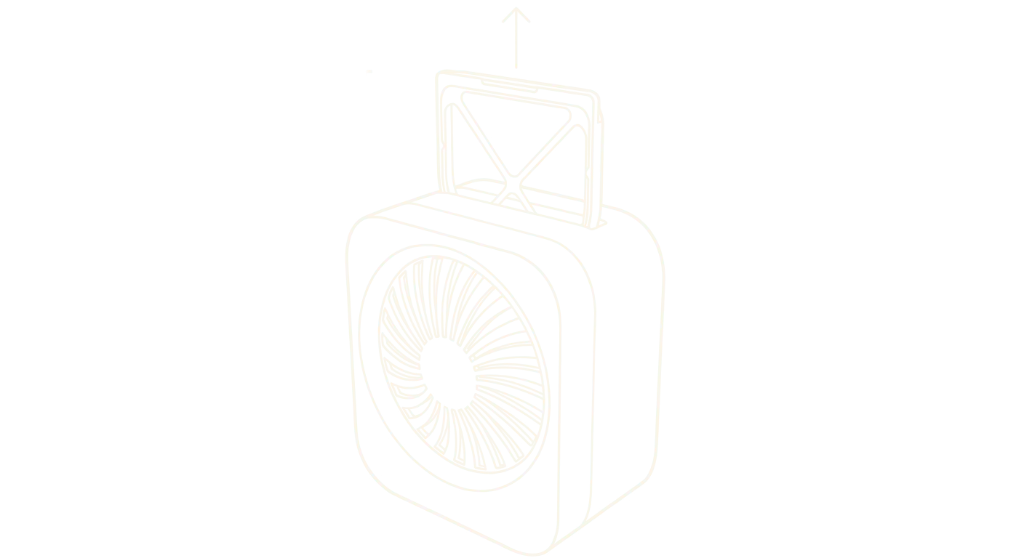
With the device stopped, the operator scans the sampler and the used cartridge in the app again. The cartridge is then sealed for shipment to the laboratory, or tested on site for an immediate result. At this point most sites start the next run with a fresh cartridge.
Stage 2
Runs only at sites where a point-of-care instrument is deployed.
Point-of-care testing is a rapid on-site screening step, available at locations equipped with a portable diagnostic instrument that can detect specific pathogens in about an hour. Where no instrument is deployed the sample skips this step and goes straight to shipment.
A small portion of the collected sample is tested on site for a short list of priority pathogens, while the rest of the sample continues on its normal path to the laboratory.
Point-of-care testing is a simplified, self-contained version of what the laboratory does across several separate steps. The instrument's sealed cartridge performs concentration, extraction and molecular detection inside one closed unit — there is no intermediate product to track, no extract to divide, and no sequencing library to prepare. The tradeoff is scope: the instrument tests only for a preset panel of targets, where the full laboratory pipeline surveys everything in the sample.
An on-site result is available the same day the sample is collected, weeks before full laboratory data returns. That gives an early signal on high-priority pathogens while the sample continues through the standard pipeline for comprehensive analysis.
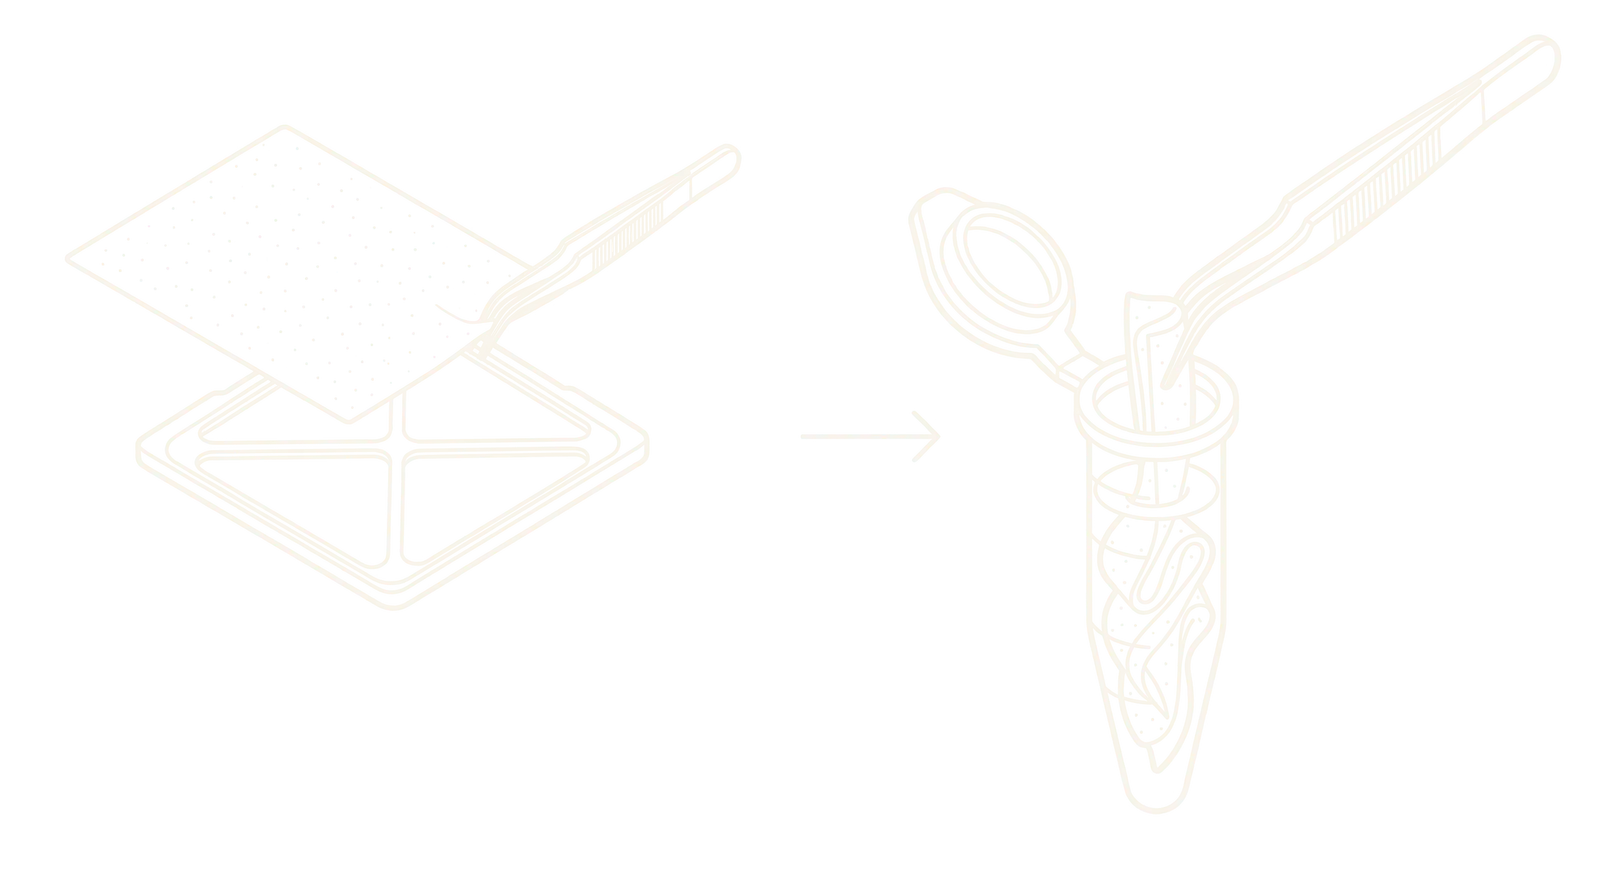
The collected sample is removed from its cartridge and eluted — washed to release the airborne particles trapped during collection — typically with PBS or PBS-Tween, a clear liquid similar to saline. A small amount of that liquid is set aside for the instrument, and the original substrate carries on to the laboratory.
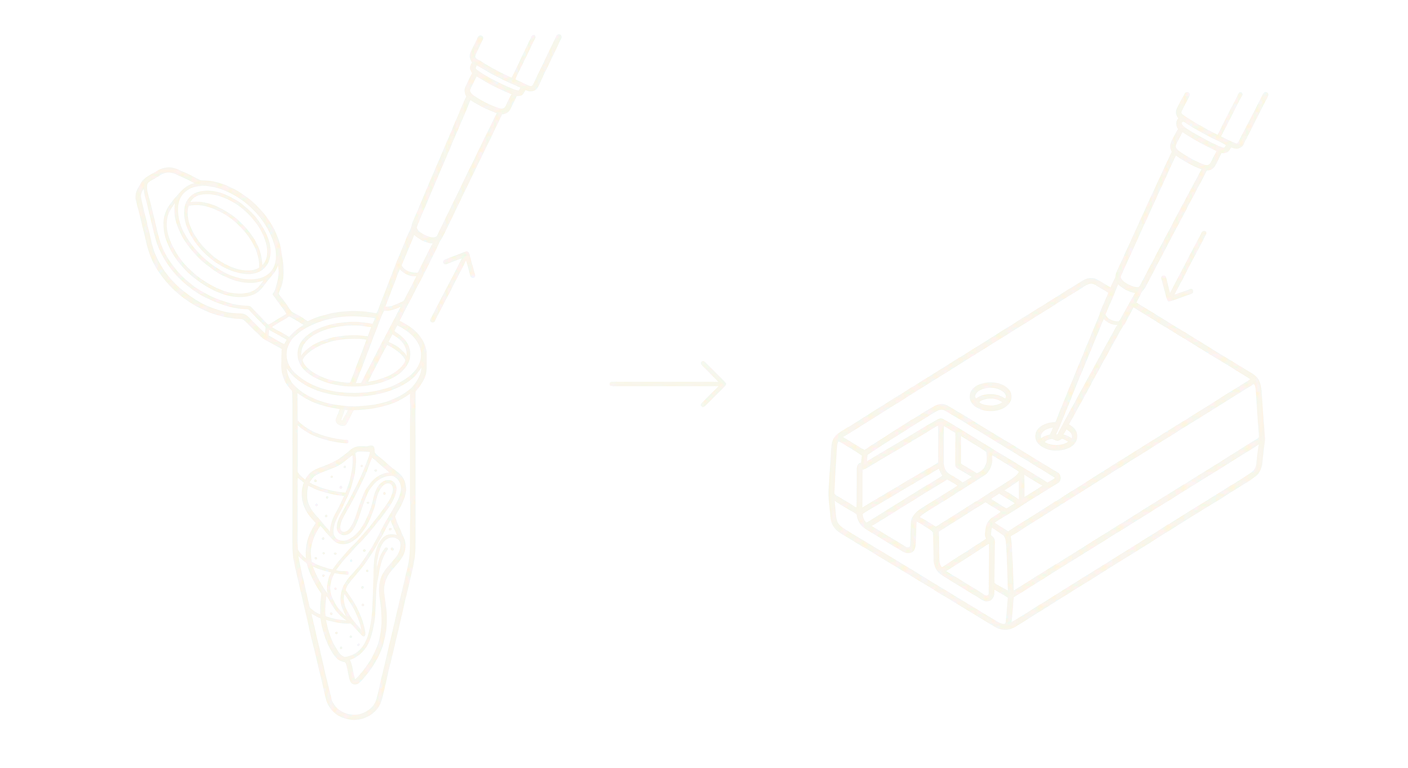
The prepared liquid is loaded into a single-use test cartridge and inserted into the instrument. From there the process is fully automated: the device amplifies any genetic material from pathogens in the sample, making millions of copies of specific DNA or RNA targets. Fluorescent probes attach to those copies and emit light that the machine detects, confirming whether a given pathogen is present — all inside one disposable cartridge, in roughly 45 to 60 minutes.
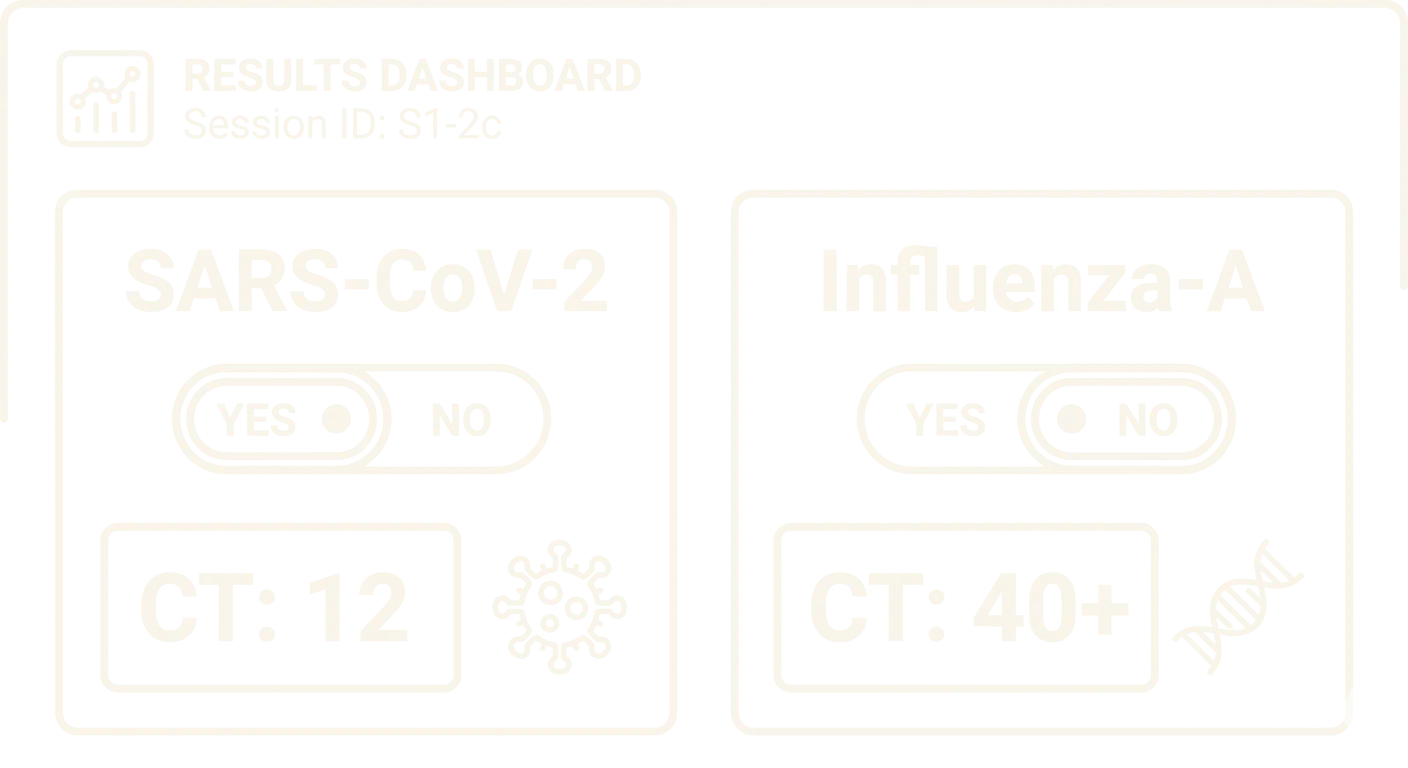
The instrument reports a cycle threshold for each pathogen on the panel — an indication of how readily the target was detected, which suggests how much of it was present. The operator records the outcome (detected, not detected, or indeterminate) along with any notes in the mobile app, linked to the same sample record created during collection.
The limitation of that value is that it does not translate directly into a concentration of viable pathogen in the air. A positive result can be hard to attribute to active infectious particles rather than to genetic fragments from non-viable organisms or settled debris in the environment.
Stage 3
Sample concentration recovers the biological material from the cartridge and prepares it in liquid form for genetic analysis. The cartridge arrives from the field carrying a substrate that trapped airborne particles during sampling. That substrate has to be washed to release its contents into a liquid, and in some cases the liquid is then reduced in volume to raise the concentration of target organisms.
Air samples hold very small quantities of biological material spread across a relatively large collection surface. Concentration makes sure enough target material is present, in a small enough volume, for the extraction and detection steps to work. Without it, pathogens present at low levels in the air could fall below the detection limit of the laboratory instruments.
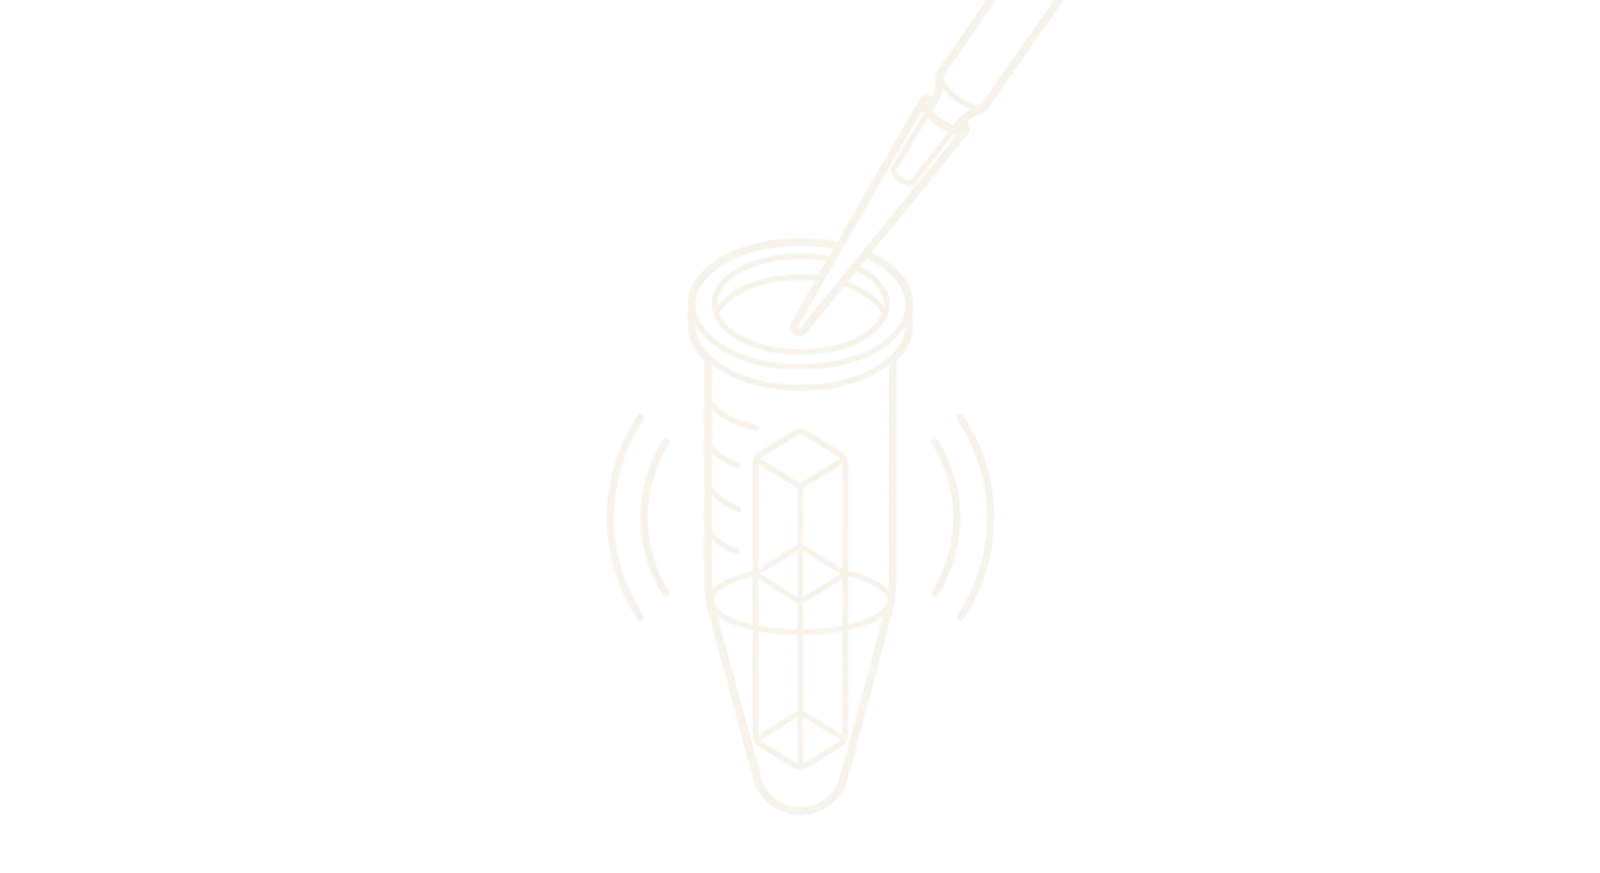
The collection substrate is removed from the cartridge and washed with a liquid buffer to release the trapped particles into solution. The technique varies by cartridge type: vortex mixing for impaction-based cartridges, wet foam elution for electrostatic collectors, or direct soaking for woven filters. The result is a small volume of liquid, typically 1 to 5 mL, containing whatever was captured from the air.
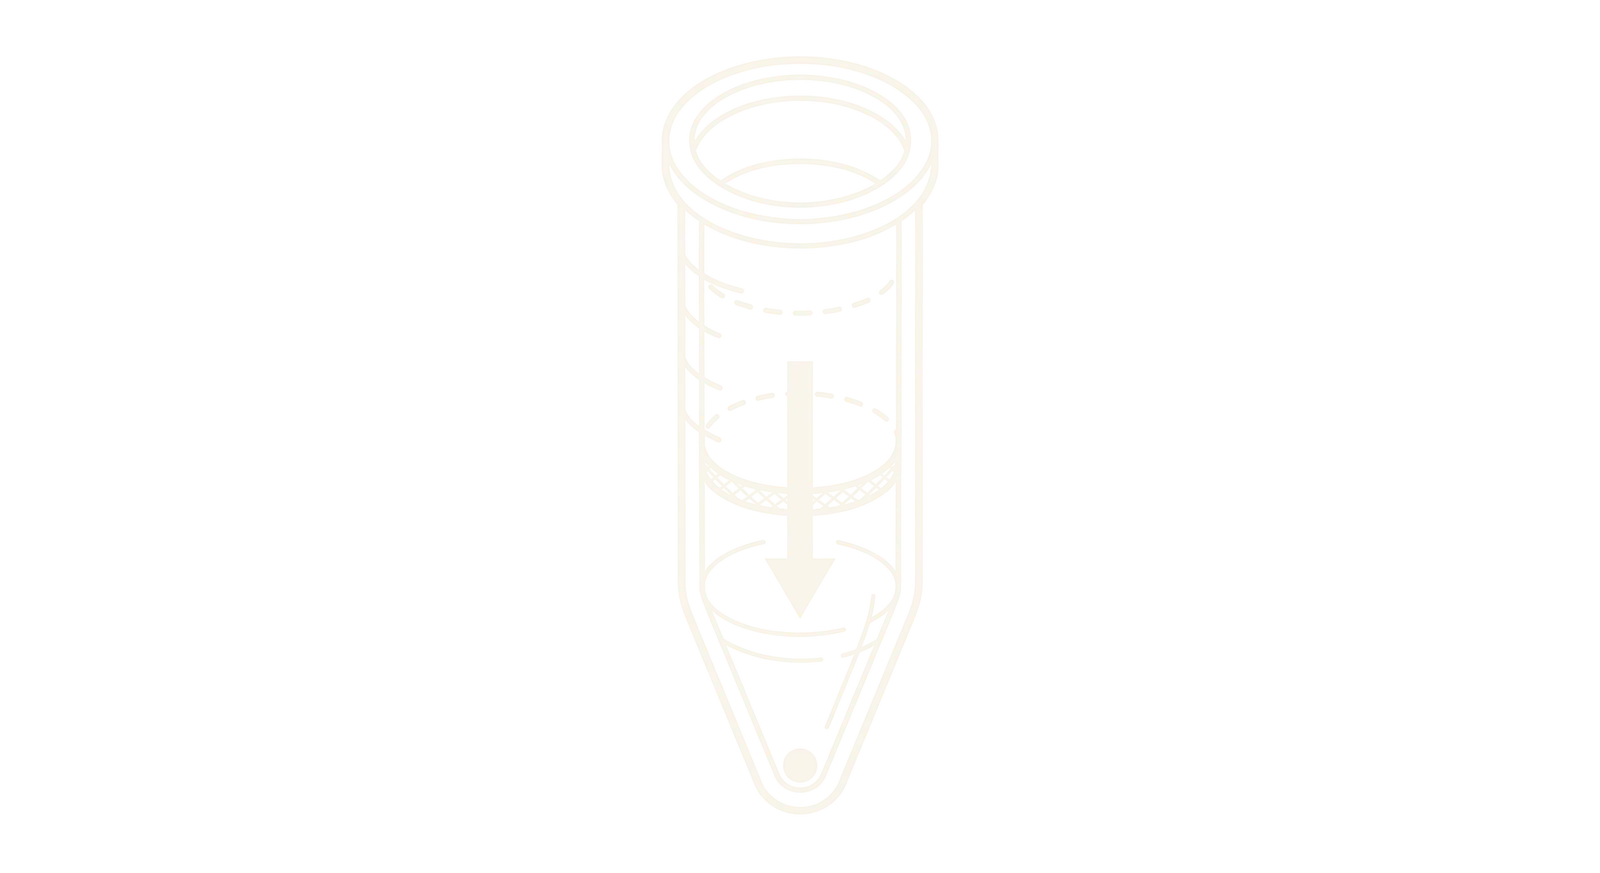
Only where the laboratory's protocol for that sample type calls for it.
If the protocol requires it, the liquid from elution is concentrated further to reduce its volume while retaining the biological material, using techniques such as ultrafiltration or chemical precipitation. For air filter substrates this is often unnecessary, and the eluate proceeds directly to extraction.
Stage 4
Extraction isolates the genetic material — DNA and RNA — from the liquid sample. It breaks open any cells or viral particles and purifies what is released into a concentrated solution called an extract. That extract is then divided into aliquots: small measured portions, each labelled for a specific downstream use, so one sample can feed several kinds of analysis at once.
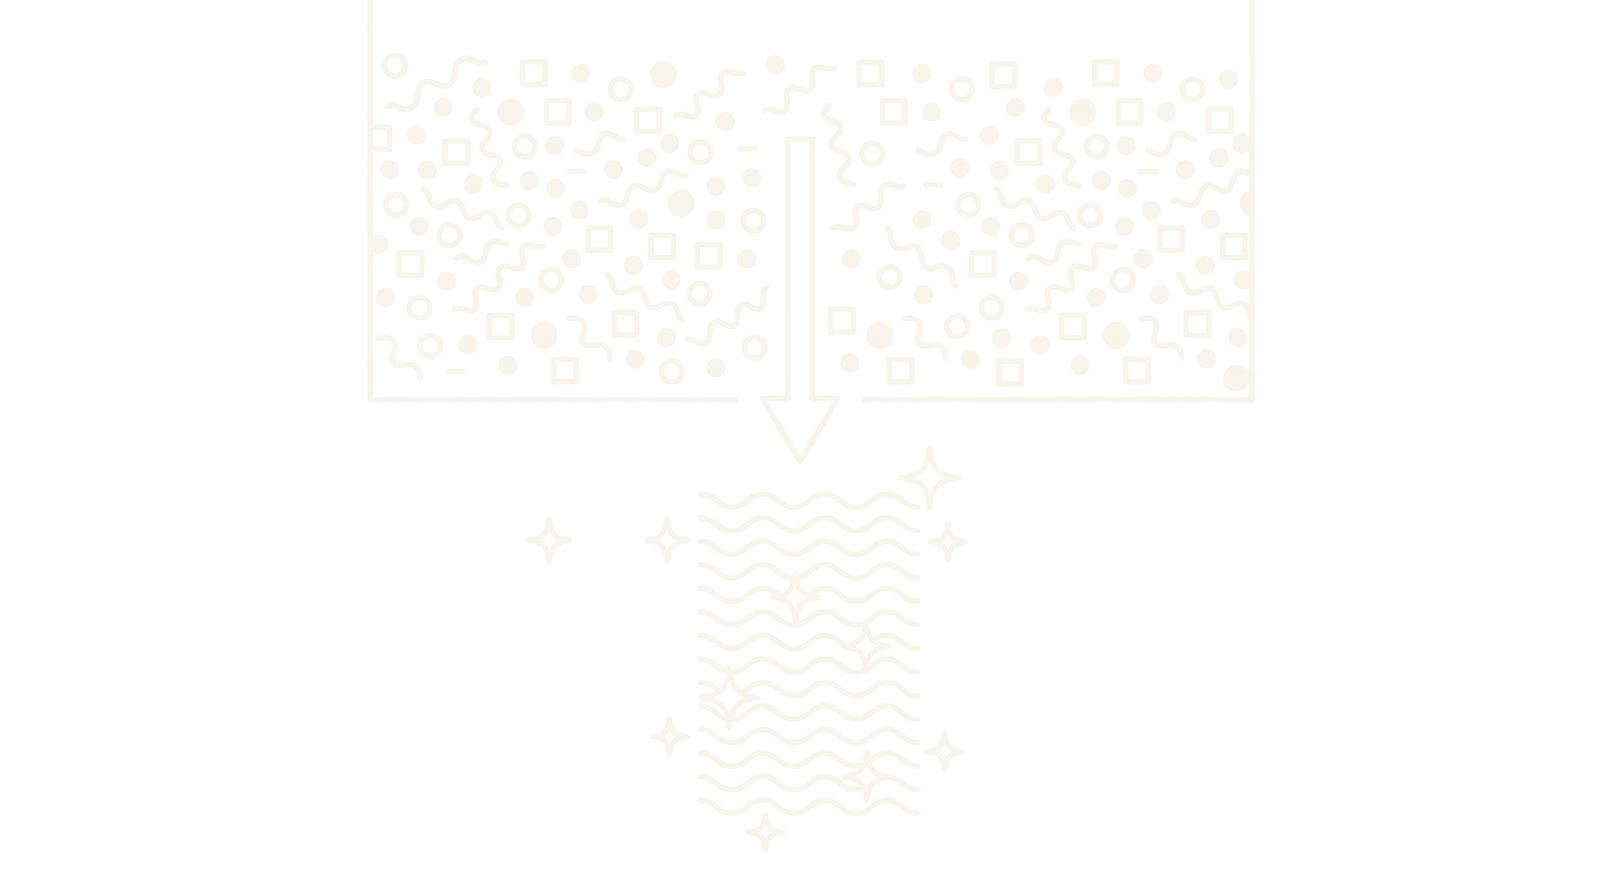
DNA and RNA are extracted together in a single process. This is the preferred approach for air surveillance because airborne pathogens include both RNA viruses, such as influenza and SARS-CoV-2, and DNA viruses; co-extracting both avoids running separate protocols for each.
The result is a purified extract — the first formally tracked intermediate product in the laboratory workflow. From this point forward every downstream step refers to the extract rather than to the original sample.
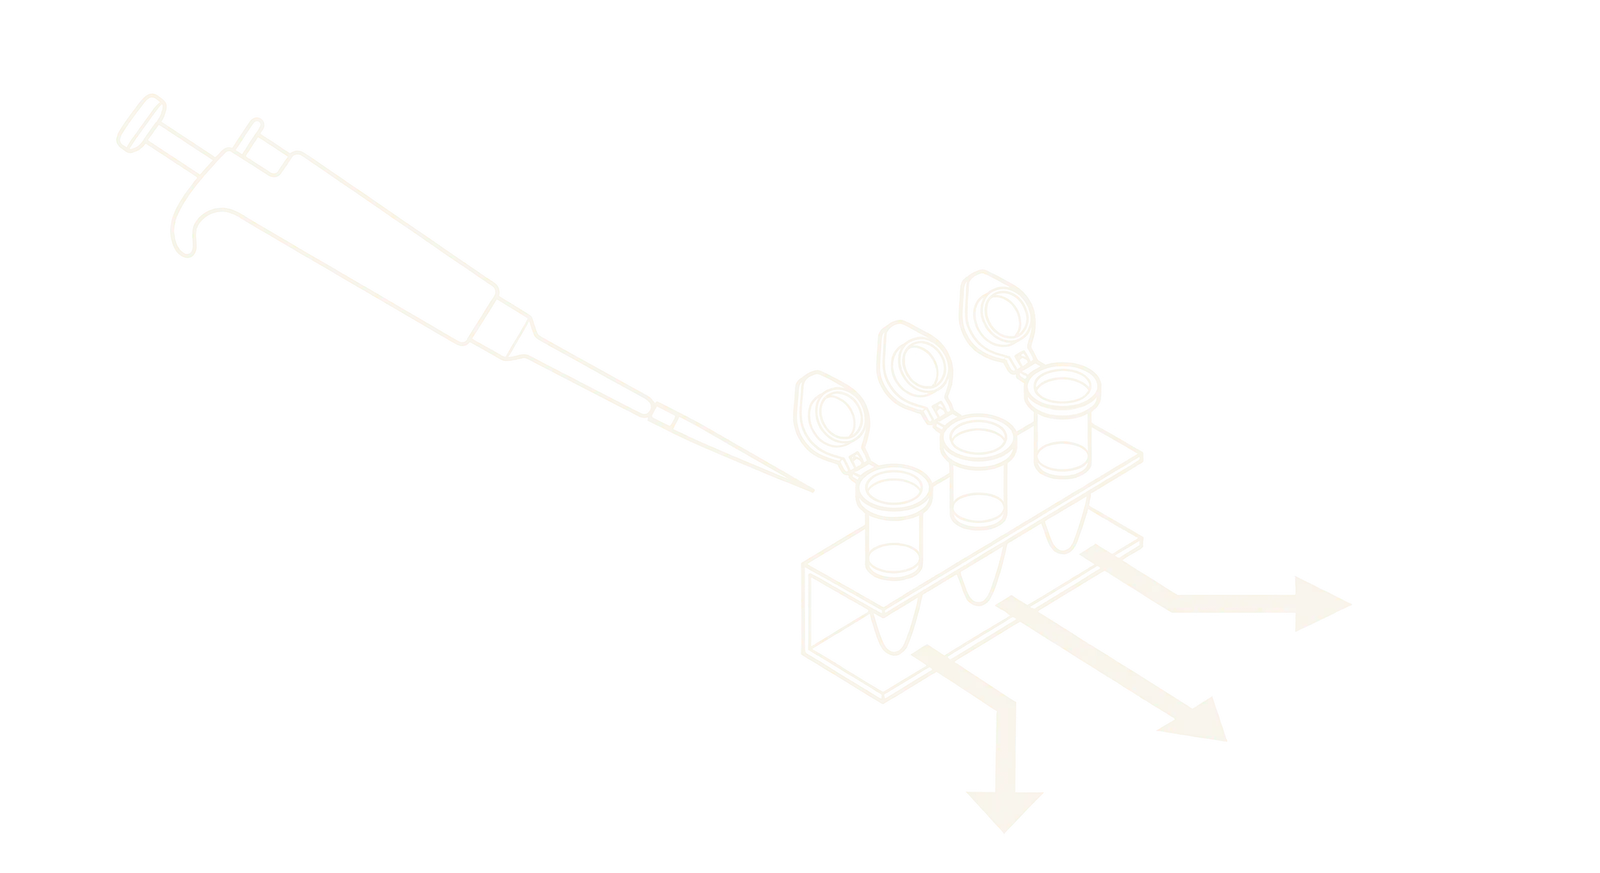
The purified extract is divided into smaller portions, each designated for a different use. A typical split produces one portion for rapid PCR-based pathogen detection, a second for sequencing library preparation, and a third for long-term archival storage.
This is the branching point of the workflow. The PCR portion follows a faster path that produces targeted results within days, while the sequencing portion enters the longer metagenomics pipeline that surveys the full range of organisms present in the sample.
Stage 5
Runs on one extract aliquot, alongside sequencing rather than before it.
One portion of the extracted genetic material is reserved for rapid targeted testing using PCR, a technique that copies specific DNA or RNA sequences until they reach detectable levels. Unlike the sequencing pipeline, which surveys everything in a sample, PCR looks only for organisms chosen for monitoring ahead of time.
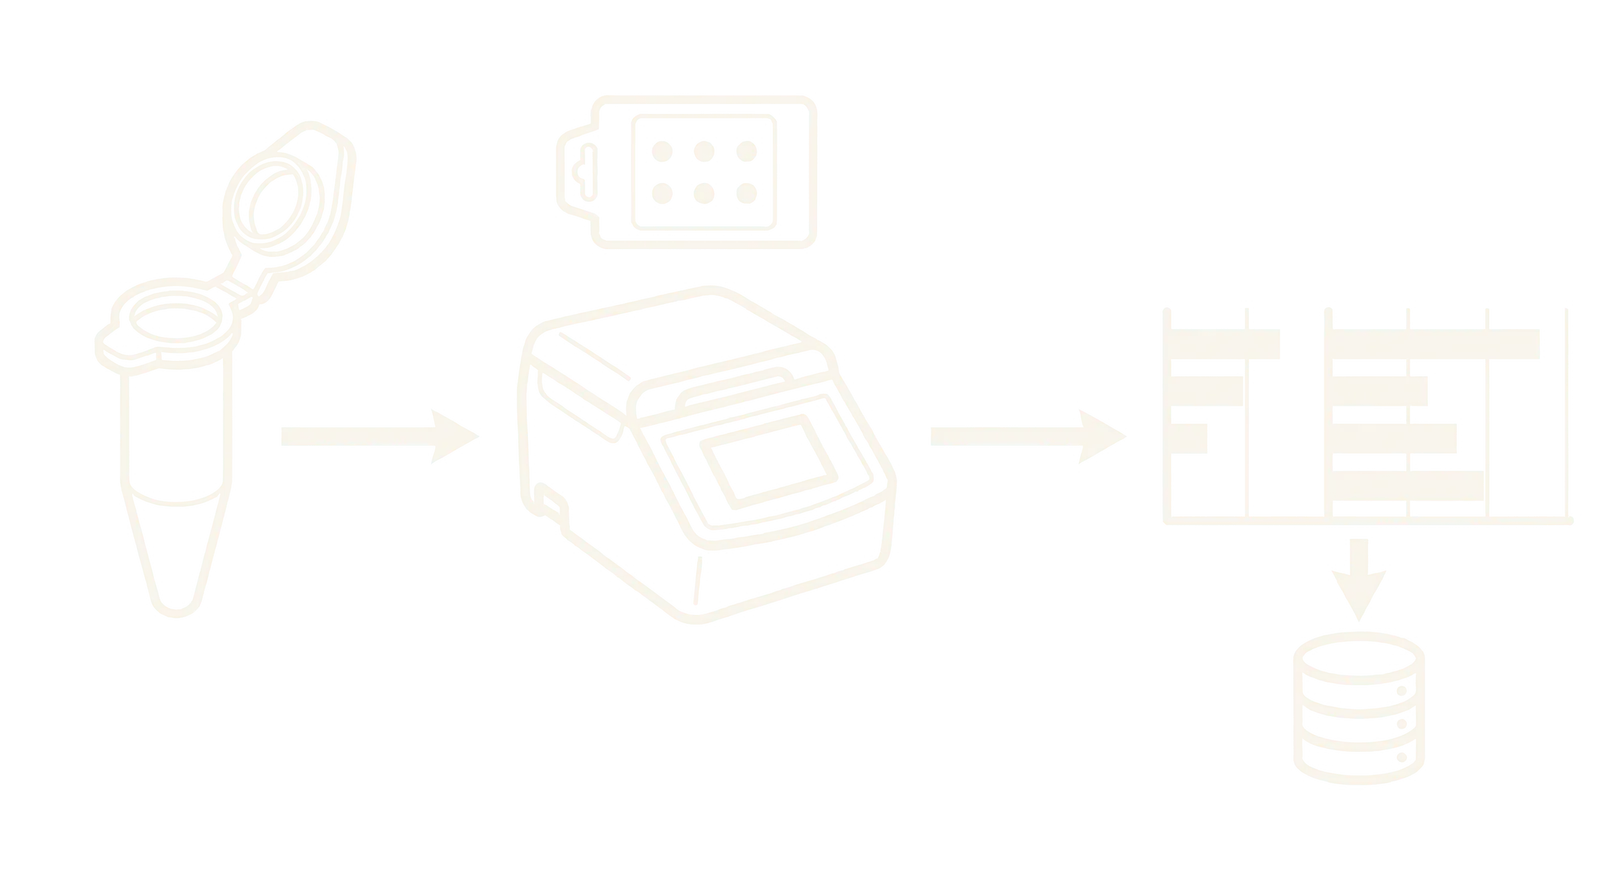
The laboratory selects an assay panel — a preset menu of pathogen targets such as SARS-CoV-2, influenza A and B, RSV or norovirus. The sample is loaded onto a PCR instrument, which runs the amplification reaction for each target on the panel. Every target produces its own result: a detection call, and a quantitative measurement of how much of that organism was present.
Each run carries built-in checks that the assay worked correctly:
PCR results are available days to weeks before full sequencing data returns, providing an early warning signal for surveillance targets. It is a terminal path within the laboratory stage: the results rejoin the broader data stream during interpretation.
Stage 6
The sequencing portion of the extract is prepared for the sequencing instrument by converting it into a sequencing library: a modified form of the genetic material that the instrument can read. Libraries from several samples are then combined into a single pool so they can be sequenced together in one run, which reduces both cost and turnaround time.
Raw genetic material cannot be loaded directly onto a sequencing instrument. It first has to be cut into small fragments, then fitted with two kinds of molecular tag:
The tagged fragments are then amplified and filtered by size to produce a finished library, ready for sequencing.
Sequencing instruments process millions of fragments per run, far more than a single sample requires. Pooling combines libraries from multiple samples into one tube so they share a single run, and each library's index barcode ensures the data can be separated back out afterwards — a later step called demultiplexing. The pool is carefully balanced so that each sample gets roughly equal coverage in the final data.
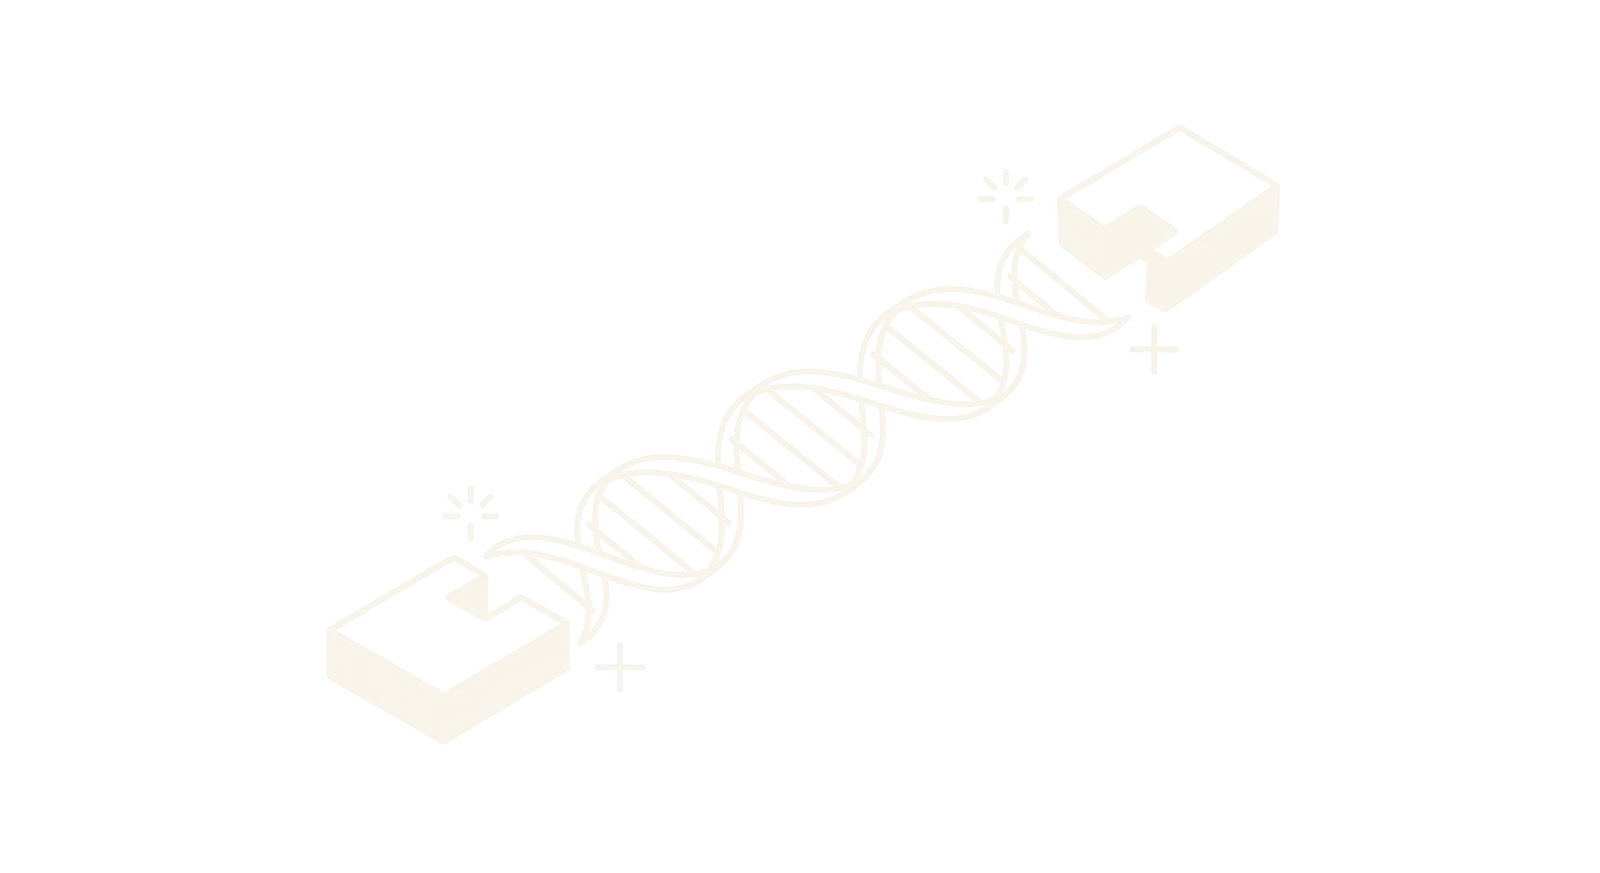
The genetic material is fragmented and fitted with adapters and index barcodes, then amplified and size-selected into a finished library.
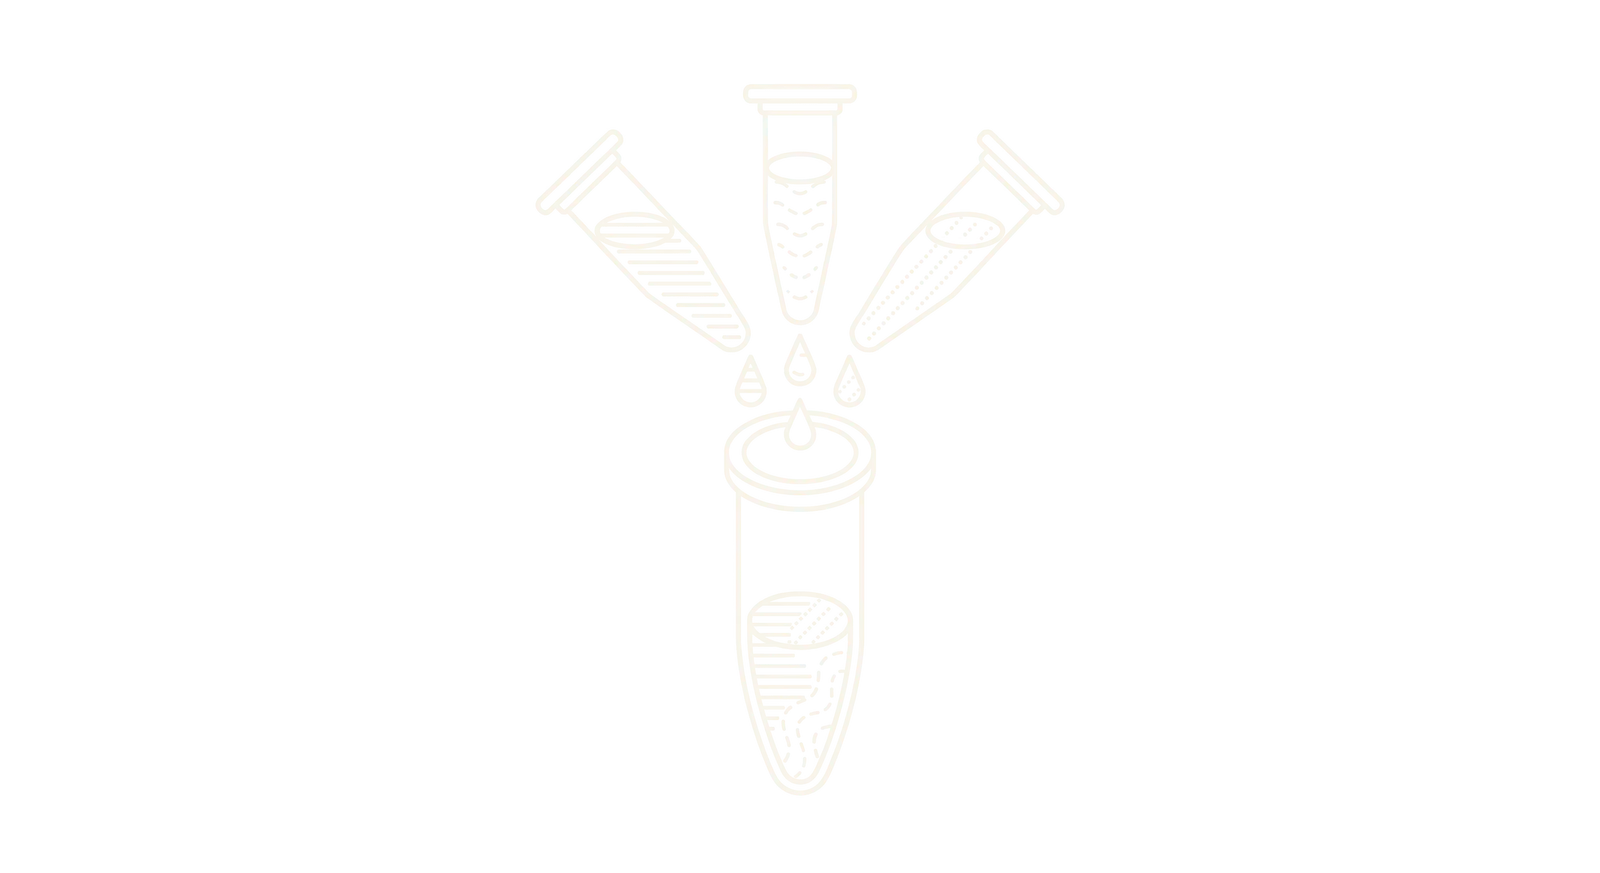
Libraries that pass quality control are combined and normalized into a single pool at a target concentration, ready to be loaded onto the sequencing instrument.
Stage 7
Data distribution is where the sequencing data leaves the sequencing centre for the systems that will store and analyse it. The same set of files is sent to two destinations at once — a permanent archive and a high-performance computing environment — so that long-term preservation and active analysis can begin in parallel.
After sequencing and demultiplexing, each sample's data exists as a separate FASTQ file: a standard format holding millions of short genetic sequences, called reads, with a quality score for every individual base. These per-sample files are the starting material for all downstream analysis. A typical sequencing run produces dozens of them, totalling anywhere from 50 to 400 gigabytes depending on the instrument and the run configuration.
The archive and the analysis environment serve different purposes. The archive is append-only: once data is written it is never changed or deleted, which makes it the reproducibility anchor — if any analysis needs to be rerun from scratch, the original data is available exactly as it was received. The computing environment consumes the data instead, running it through pipelines that transform, filter and classify it. Keeping those roles separate means analysis never risks altering the source material.
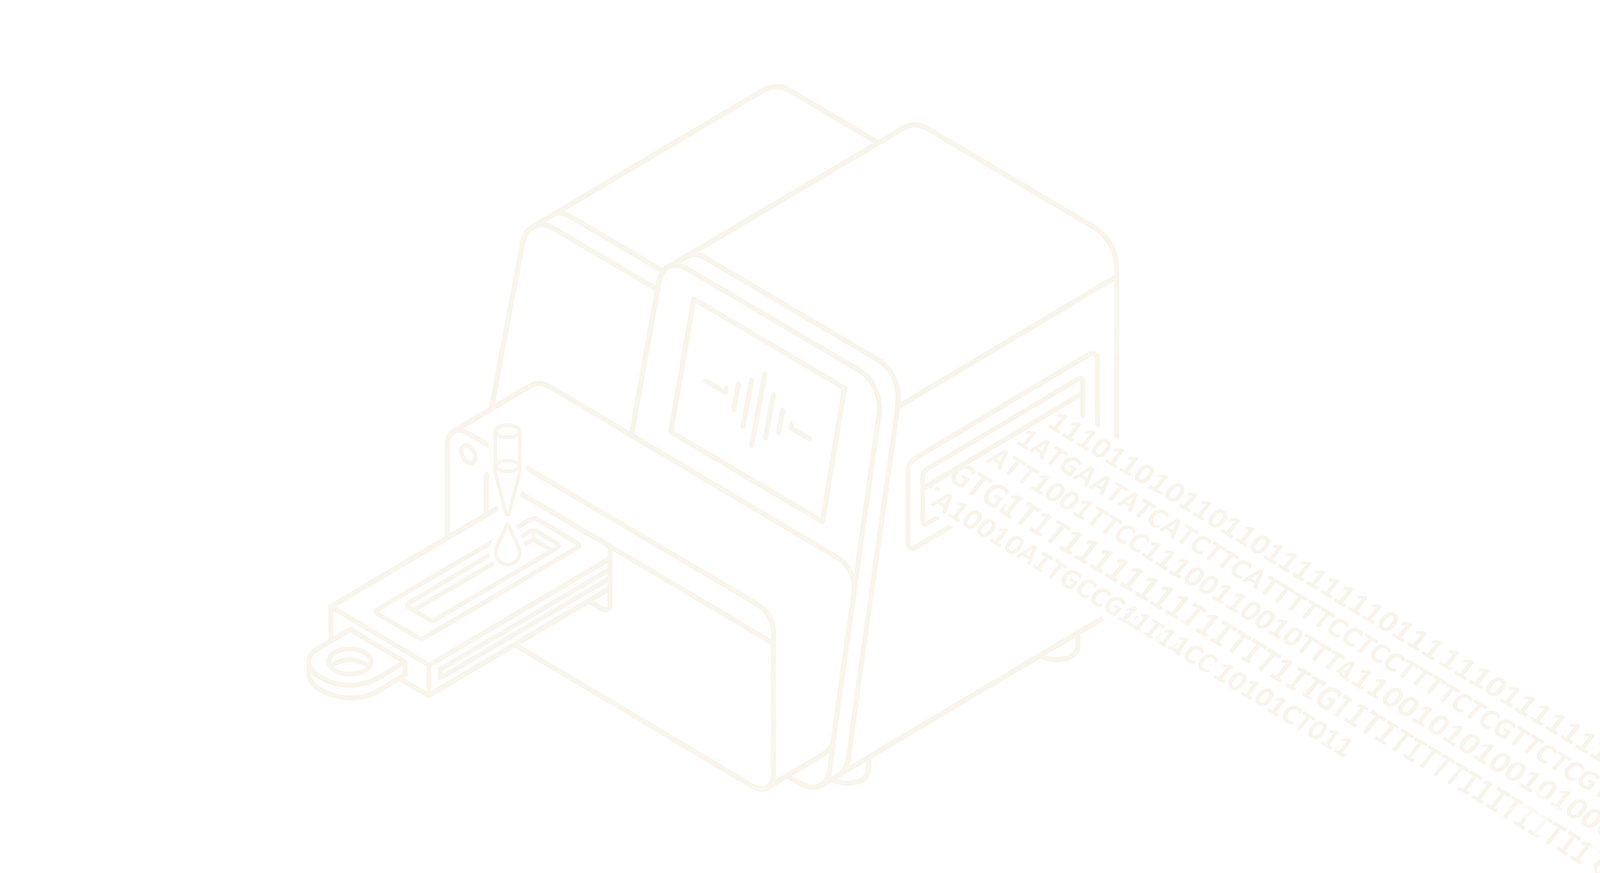
The pooled library is sequenced, producing the per-sample read files that everything downstream is built on.
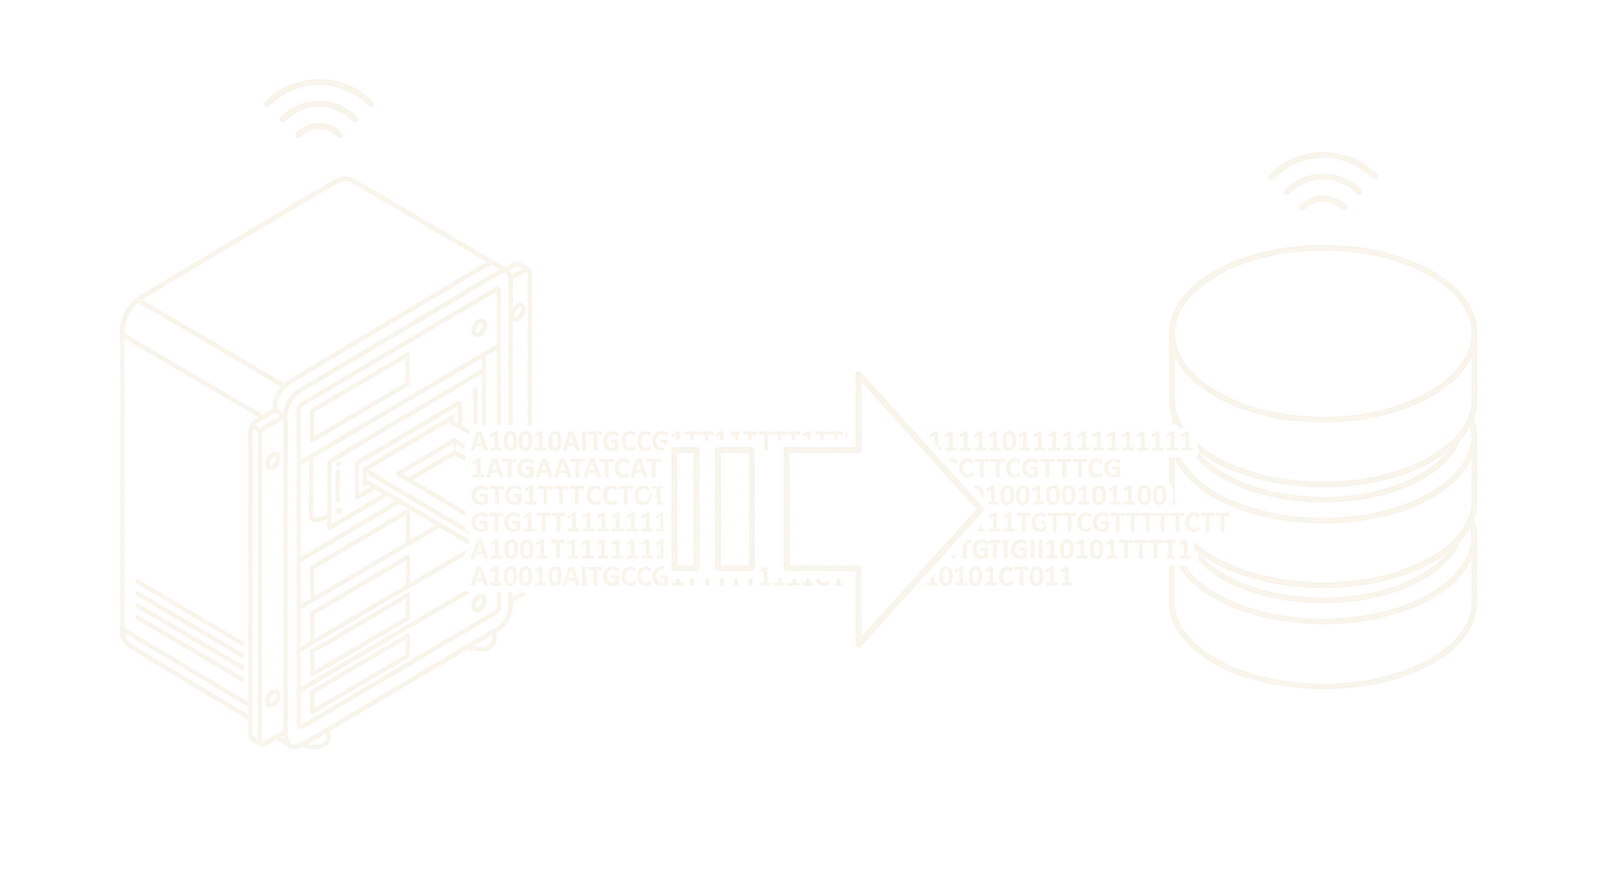
A copy of each sample’s read files is transferred to the computing environment where the bioinformatics pipelines run, with an independent backup held on separate research storage. A second complete copy is written to the permanent archive at the same time.
Stage 8
This is where the sequencing data is analysed to determine what organisms are present in each sample. The raw reads — millions of short genetic fragments per sample — are run through a series of computational pipelines that compare them against large reference databases of known organisms to identify matches, verify results, and flag anything unusual.
The reference databases used for comparison are very large; the primary BLAST database alone exceeds 100 gigabytes. Each sample generates temporary working files during analysis that can expand the data volume three to five times beyond the original input. Intermediate results are cached at each stage, so that if a step fails the pipeline can resume from the last successful point rather than starting over.
Every pipeline run is tracked as a versioned, reproducible record, capturing the exact software version, database versions and configuration used. Any result can be traced back to the precise conditions that produced it, and any analysis can be rerun identically. The combined output is a set of per-sample classification results, verification statuses and, where applicable, variant assignments.
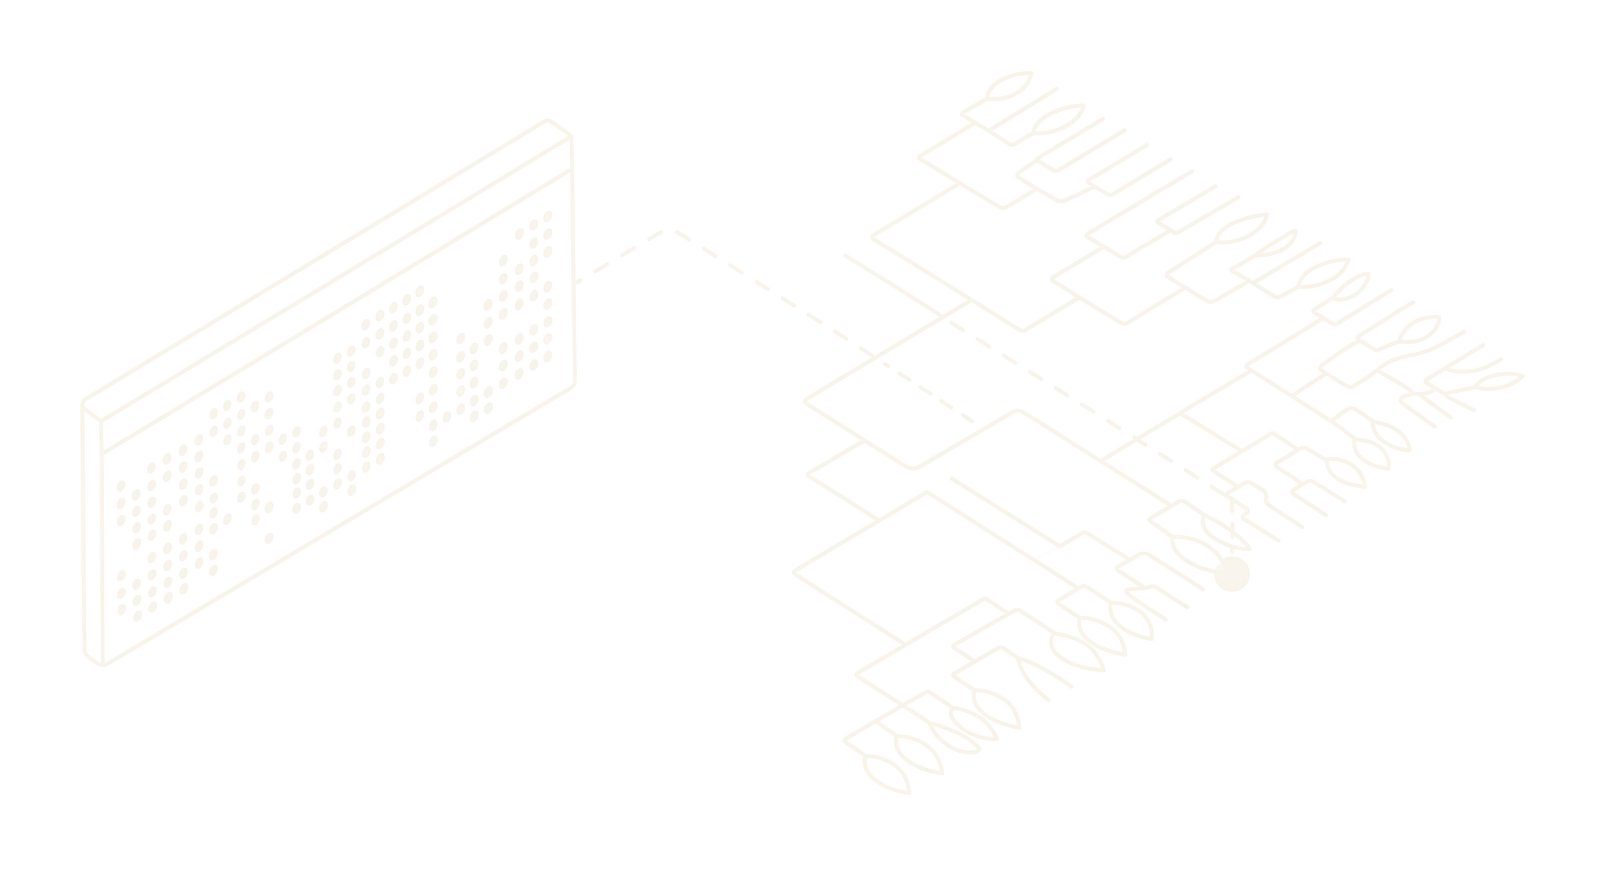
Every read in the sample is compared against databases of known genetic sequences to assign it to an organism. Several classification tools run on the same data using different matching strategies — one comparing short sequence fragments against a pre-built index of known genomes, another looking for genetic signatures that appear only in a single species. Each produces a list of candidate organisms with a confidence score and a count of matching reads.
Running several tools in parallel increases reliability: an organism detected by two independent methods is more likely to be a real finding than one flagged by a single tool.
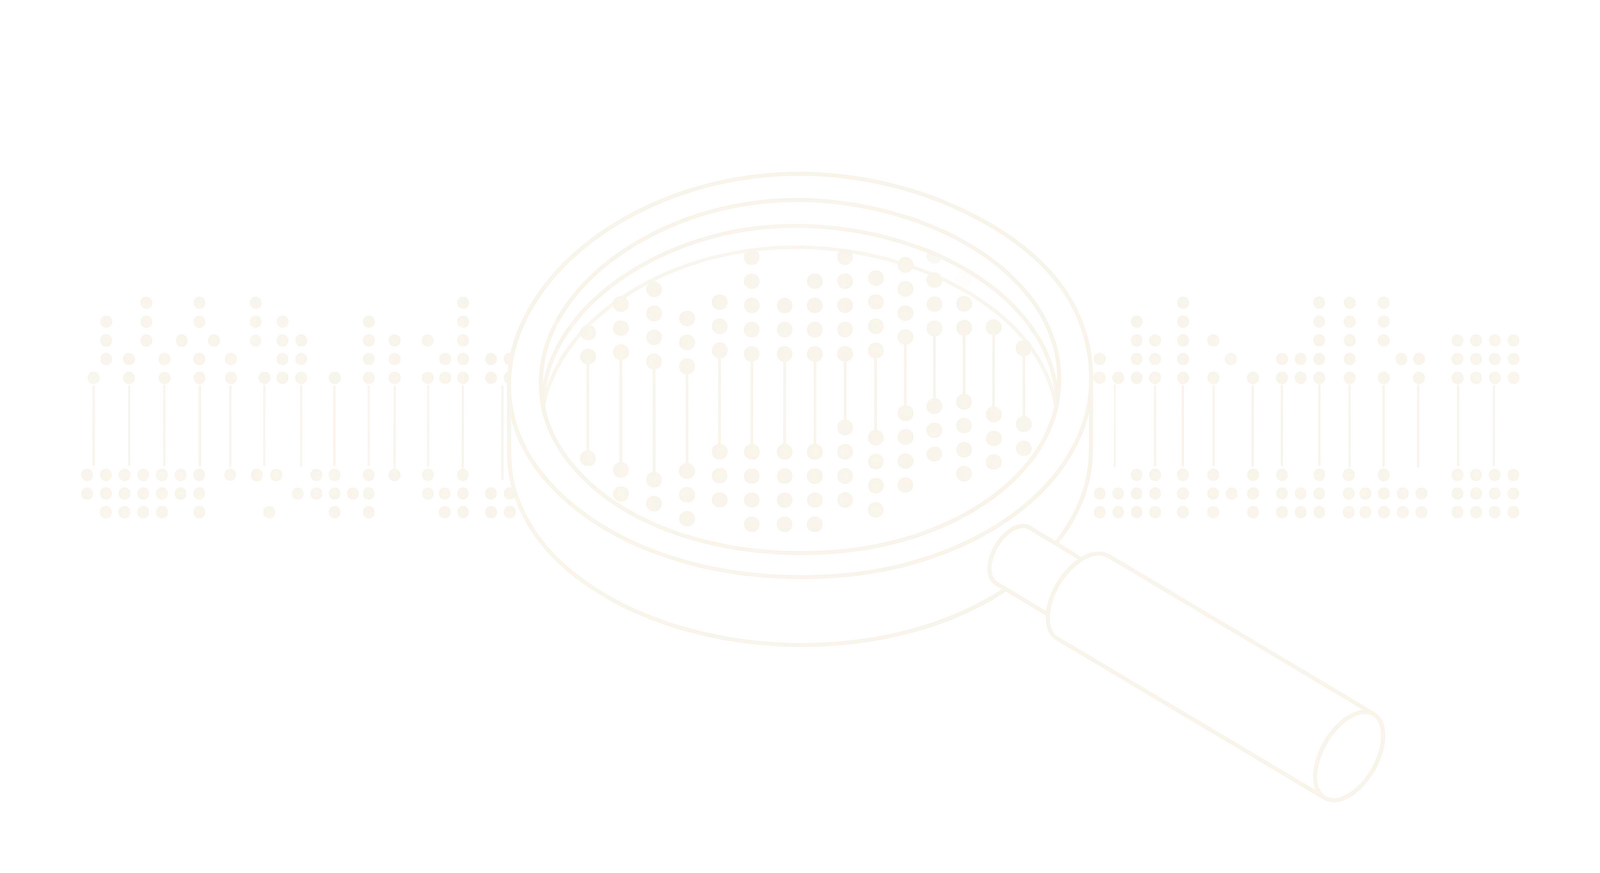
Detections flagged as novel, unexpected or low-confidence are checked a second time using a more thorough search method. This aligns the flagged sequences against a comprehensive reference database and returns detailed similarity metrics, so each detection is either confirmed, rejected, or resolved to a broader organism group where the match is ambiguous.
Runs only when a priority target is detected and confirmed.
For confirmed detections of priority surveillance targets such as SARS-CoV-2, specialised pipelines determine the specific lineage or variant present. A separate pipeline scans for previously uncharacterised viral sequences that match no known reference.
Schools, healthcare facilities, businesses, municipalities, research organizations and more can join the Lungfish network by participating in our air or wastewater sampling programs.
Get in touch →